
The human resource industry is in a state of flux, facing disruptions from job automation, talent shortages, remote work trends and advanced technologies that impact HR software and HCM systems, such as AI, machine learning and big data analytics.
The confident HR manager looks into the future armed with the latest data on the HR industry, from HR consulting services to HR software vendors, and privy to recruitment developments disrupted by remote work and the evolving preferences of Gen Z and Millennial job seekers. So, too, must you.
This article has collated key HR and HR software statistics from the most recent and credible reports. Use this as your blueprint moving forward in 2022 and beyond.

Key HR Software Statistics Table of Contents
HR Consulting Services Statistics
HR consulting service firms are recovering from the COVID-19 impact, with industry leaders registering decent growth rates. But they lag behind HR tech companies.
- Manpower, Adecco and Randstad comprise 15% of the global HR service market share, specifically, Manpower with 4%, Adecco with 5% and Randstad with 6% share. (Randstad, Bloomberg, 2021)
- By revenue, the Allegis Group tops the list with $10.4 billion, followed by Randstad with $6.4 billion and Robert Half International with $5.12 billion. Kelly Servies ($4.5 billion), Adecco ($4.3 billion) and Express Employment Professionals ($3.4 billion) round up the top five staffing firms by revenues. (Zippia, 2021)
- Staffing firms in North America had expected a revenue growth between 11% and 25% from 2020 to 2021 the most (30%) compared to a 10% growth rate (10%) or a 25% growth rate (20%). Twenty-two percent were unsure of their revenue growth in the said period. (Bullhorn, 2021)
- HR tech companies are recovering faster than HR consulting companies since the onset of the pandemic. The stock price indices of Service Now, Ceridian and Workday, at 188, 154 and 141, respectively, easily top those of consulting firms ADP (104), Randstad (98), Adecco (97) and Manpower (93) (Yahoo Finance, 2021).
Source: Zippia, 2021
HR as a Profession Statistics
HR as a career is still predominantly the realm of females, as, overall, the sector sees a steady increase in demand after a brief disruption by the pandemic.
- Females dominate the HR manager profession with a 76.8% share versus males (23.2%). (BLS, 2021)
- There is a steady increase in the number of HR managers year over year. From 110,650 of them in 2013, their number ballooned to 156,600 in 2020. (BLS, 2021)
- By industry, Management of Companies and Enterprises leads in the employment of HR managers in the United States, with 22,690 as of 2020, followed by Local Government (excludes schools and hospitals) with 8,540, Computer Systems Design and Related Services with 6,850, Employment Services, with 6,510 and Management, Scientific and Technical Consulting Services, with 6,470. (BLS, 2021)
- The biggest growth rate in the number of HR managers happened between 2018 and 2019 at 7.8%, while the lowest was between 2019 and 2020, at the height of the pandemic. (BLS, 2021)
- California tops the most number of HR specialists by employment in the US with 75,340 in 2021. Texas has 50,090 HR professionals, followed by New York with 39,720, Florida with 38,290 and Ohio with 29,500. (BLS, 2021)
- The number of HR employees is steadily increasing with a brief disruption during the start of the pandemic. From 571,640 in 2015, they now number at 780,372 in 2022, a 36.51% growth. (BLS, 2021)
- By 2025, the number of HR employees will reach 840,120 or a 7.56% increase from 2022. (BLS, 2021)

HR Salary Statistics
HR managers are seeing a consistent increase in mean annual wage even as the profession still lags behind other managerial positions in salary.
- Securities, Commodity Contracts and other Financial Investments and Related Activities has the highest annual mean wage for HR managers ($184,440) in 2020. Scientific Research and Development Services comes in second ($183,030), followed by Other Information Services ($181,000). Rounding up the top five are Monetary Authorities-Central Bank with an annual mean wage of $180,180 and Calbe and other Subscription Programming with $176,290. (BLS, 2021)
- New Jersey has the highest annual mean wage for HR managers by state ($177,960). The other top states are: New York ($169,290), District of Columbia ($167,190), Rhode Island ($160,500) and California ($154,030). (BLS, 2021)
- By metropolitan area, New York-Newark-Jersey City has the highest salary for HR managers with $179,870 annual wage. This is followed by Chicago-Naperville-Elgin with $131,240, Los Angeles-Long Beach-Anaheim with $149,980, Boston-Cambridge-Nashua with $159,580 and San Francisco-Oakland-Hayward with $174,710. Completing the top metropolitan areas are: Washington-Arlington-Alexandria ($160,030), Atlanta-Sandy Springs-Roswell ($128,770), Minneapolis-St. Paul-Bloomington ($133,510), Philadelphia-Camden-Wilmington ($142,810) and Houston-The Woodlands-Sugar Land ($140,120). (BLS, 2021)
- HR managers are at 11th place by highest mean annual wage among management jobs in the US, with earnings of $134,580. CEOs top the list with $197,840, then Computer and Information Systems Managers with $161,730, Architectural and Engineering Managers with $158,100, Natural Sciences Managers with $154,930 and Marketing Managers with $154,470. Just above HR managers are PR managers with $135,580, Compensation and Benefits managers with $137,160 and Ad and Promotions managers with $147,560. (BLS, 2021)
- In terms of mean annual wage, HR managers in the US saw a steady increase from $53.45 in 2013 to $64.7 in 2020, a 21% growth rate. (BLS, 2021)
Source: BLS, 2021
Job Automation Statistics
HR managers must stay on top of job automation trends to help them craft strategy shifts to where human skills and development will still be needed the most, especially in the tech industry as companies scramble for talents in the face of skills shortage.
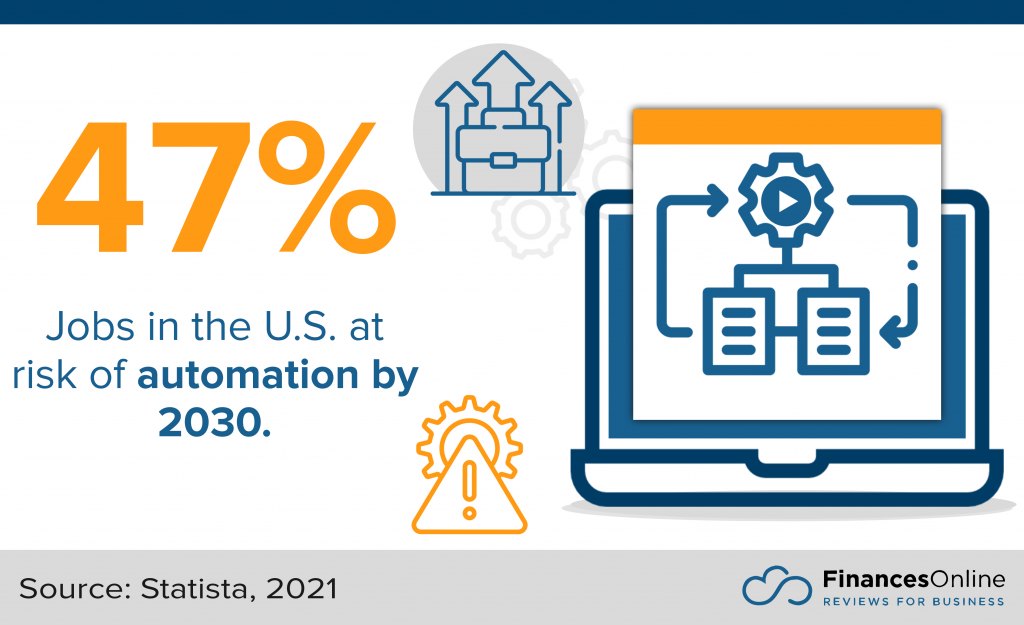
- 47% of jobs in the US are at risk of automation by 2030. In the United Kingdom, it’s 35% while in Germany it is at 35%. (Statista, 2021)
- In Europe, Slovakia has the highest share of jobs at risk of automation through 2030, with 44%. Rounding up the top five European countries with the highest job automation risk are Slovenia with 42%, Lithuania with 42%, the Czech Republic with 40%, and Italy with 39%. The UK places 14th with 30% while Finland has the least risk of job loss due to automation, with 22%. (PwC, 2021)
- Broken down by gender, males will experience the highest job loss due to automation by 2030 in Lithuania (55%) and the least in Greece (27%). For females, the highest job risk is in Slovenia (39%) and the lowest is in Russia (13%). (PwC, 2021)
- In the US, transport and logistics has the highest risk of automation by 2030 at 70.5%. This is followed by energy utilities and mining at 46.5%, consumer goods, accommodation and food services at 42.5%, manufacturing and construction at 42%, technology, media and telecommunications at 41.5% and financial and professional services at 40%. (Statista, 2021)
- Employment for business processing outsourcing (BPO) service workers will decrease from 4.88 million employees in 2016 to 4.39 million in 2022 due to job automation. (HfS Research, 2020)
- The decrease will happen among low-skilled BPO workers with a 31.35% decline from 2016 to 2022. However, the opposite is true for medium- and high-skilled BPO workers, both of which will see an increase of 4.64% and 56.76% increase, respectively, in the same period. (HfS Research, 2020).
- 26% of executives in the US expect a job reduction of 5% to 10% due to automation between 2019 and 2023, the highest among expectations. On the other hand, only 14% expect an 11% to 20% job loss while 10% expect the job loss to be more than 20%. (BCG, 2021)
- In China, executives’ expectations of job loss due to automation paint a slightly different picture: 5% to 10% (24%), 11% to 20% (22%), and more than 20% (21%). (BCG, 2021)
Tech Jobs
- Even as job automation results in job loss, tech jobs are enjoying more openings. In 2020, there were 634,660 new jobs in software development methodologies, 462,963 in cloud technologies, 373,123 in proactive security, 282,380 in IT automation and 197,810 in AI and machine learning. (Forbes, Burning Glass, 2021)
- Quantum computing is predicted to have the fastest job growth in North America from 2021 and beyond, enjoying a 135% growth rate. It is followed by connected technologies (104%), fintech (96%), AI and machine learning (71%), IT automation (59%), NLP (41%), proactive security (39%), software development methodologies (35%), cloud technologies (28%), and parallel computing (17%). (Forbes, Burning Glass, 2021)
HR Technology Statistics
HR software statistics point to the tech industry showing a confident expansion in the coming years spurred by a business landscape needing to go digital to mitigate the pandemic’s disruption. Should they fully embrace digitization, HR organizations can achieve greater cost-effectiveness. (Yahoo Finance, 2021)
- The HCM software market worldwide is seeing a steady growth from $30.8 billion in 2019 to 33.04 billion in 2024. (Apps Run the World, 2021)
- HCM has the second highest share among cloud applications by functional market in 2020, with a 13.90% share. The top spot goes to CRM with a 23.80% share. Both ERP and collaboration have a 7.90% share while procurement has a 5.60% share. (Apps Run The World, 2021)
- HCM is the eighth cloud application market by segment with the highest annual growth rate from 2017 to 2022, at 3%. Analytics and BI take the top with 3.3%, with collaboration closely behind with 3.1% growth within the same period. Meanwhile, content management is the only segment that will register a negative growth (-0.5%). (Apps Run The World, 2020)
- Beisen has the largest HCM SaaS market share in China with 15%, followed by KNX with 9%, Inspur with 6%, SAP with 5% and Dayee with 3%. The rest of the market comprises a 62% share. (IDC, 2021)
- From $47.4 billion, the HR tech market size will reach $90 billion by 2025, an 89.87% jump. (Statista, 2021)
- Incumbent HR tech companies dominated the market vs. startups, at 95.9% vs. 4.1% in 2019. But startups will double their share by 2025, with the shares adjusting to 91.8% incumbents vs. 8.2% startups. (Statista, 2021)
- In terms of share of HR tech headquarter’s location, there will be a slight decrease in HR tech firms locating their office in North America, from 79% in 2019 to 77.7% in 2025. In the same period, APAC will see a subtle increase, from 8.5% to 9.6%. (Statista, 2021)
- Mobile workforce management software will continue to grow, from $6.05 billion worth in 2022 to $7.15 billion in 2023, an 18.19% increase. (MRFR, 2018)
- The leading application tracking systems in 2020 are: Workday with 21.92% share, Taleo with 14.68%, SAP/SuccessFactors with 11.57% iCIMS with 8.94%, Greenhouse Software with 7.81%, and IBM Kenexa BrassRing with 5.27% share. (Ongig, 2020)
- Workday’s revenues saw steady growth from $2.82 billion in 2019 to $3.63 billion in 2020 and $4.32 billion in 2021. (Workday, 2021)
- As part of the broader tech industry, HR tech will be impacted by these priority concerns for new legislation and regulation: cybersecurity (94%), data privacy, data protection and data sharing (92%), sexual abuse and exploitation of minors (90%), misinformation/disinformation (86%) and tax contribution (81%). (Clifford Chance, YouGov, Miltown Partners, 2021)
Source: IDC
HR Tech Functions
Businesses turn to the best HCM systems, not as an all-in-one solution. A select set of features tends to be more favored over the others.
- Personnel management and payroll has the biggest share by function in the HR tech market share at 57.8% in 2019. This is followed by recruitment at 26.4% and engagement and connectivity at 10.3%. Completing the pie are learning and development at 3.2% and recognizing and rewarding at 2.3% for the same year. However, by 2025, engagement and connectivity will expand to 24.8%, shrinking the share of personnel management and payroll and recruitment to 55.6% and 15.7%, respectively. (Statista, 2021)
- The largest segment in the HR tech market, personnel management and payroll is dominated by incumbents. But from a 95.3% share in 2019, their share will slide to 92.4% in 2025. (Statista, 2021)
- Meanwhile, digital recruitment services will see a steady decline in market share, from 26.4% in 2019, its share will shrink to 15.7% by 2025. (Statista, 2021)
- Engagement and connectivity will see the largest jump in HR tech share by function, with revenues of $4.9 billion in 2019 increasing to $22.3 billion in 2025. (Statista, 2021)
- HR tech startups are expected to focus on the learning and development segment from 2019 to 2025. From a 1.5% share in 2019 in this segment, startups will increase their slice to 2.4% in 2025. (Statista, 2021)
- APAC is the only region where HR tech sees continuous growth, from 8.5% in 2019 to 8.7% in 2021, to 8.9% in 2023, and 9.6% in 2025. (Statista, 2021)
- Time & attendance will have the biggest revenue by segment in the workforce management software industry, with a forecast of $2.56 billion in revenues in 2024. Compare this to $1.12 billion for workforce analytics, $942 million for workforce scheduling, 634 million for absence & leave management, $245 million for task management and $50.5 for fatigue management. (Apps Run the World, 2021)
Most Popular HR Software
- BambooHR. A widely-used and reliable HR software that’s designed for SMB operations. You can know more about this award-winning solution in this BambooHR review.
- Zoho People. This robust HR suite helps businesses achieve better efficiency in their employee management operations. With a built-in LMS, check out this Zoho People review to know if it fits your HR requirements.
- Gusto HR. Another in-demand HR software for its smart tools and extensive HR functionalities. Read our in-depth Gusto HR review for more info.
- SmartRecruiters. An HR solution designed to cover the entire employee life cycle. Check this SmartRecruiters review to know why.
- monday.com. monday.com’s HR platform is integrated with key business tools for collaboration, project management, and CRM. This comprehensive monday.com review discusses its key features, pricing, and capabilities.
Recruitment & Staffing Statistics
The Great Resignation of 2021 is sure to continue through the next few years. Surely to impact recruitment, HR managers must come up with urgent and creative ways of hiring talents whose career preferences and life priorities are at the crossroads of a paradigm shift.
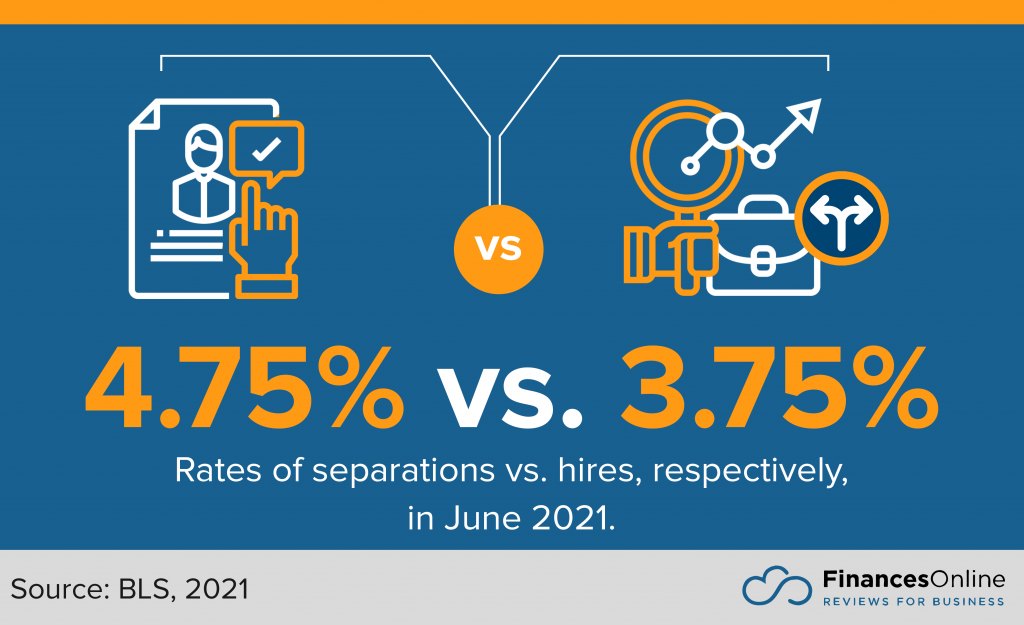
- The separations rate outstripped the hires rate in Dec. 2020, at the height of the pandemic, nearly 4.75% versus around 3.75%, respectively. By June 2021, the trend was reversed, with the hires rate overtaking the separations rate the most since the onset of the pandemic, nearly 4.75% versus about 3.75%, respectively. (BLS, 2021)
- Trade, transportation and utilities experienced the highest number of hires in 2021, with 1.38 million new employees. It’s followed by leisure and hospitality (1.26 million), professional and business services (1.22 million), education and health services (834,000) and manufacturing (485,000). (BLS, 2021)
- Inactive users still account for the most no. of LinkedIn profiles in 2021, with 51.5%. Light users followed suit with 35.1%, then middle users 7.4% and, lastly, heavy users 5.7%. (App Ape, 2021)
- The number of hires in IT in the US took a 13% dip for the first time since 2015 between 2019 and 2020, the onset of the pandemic. (BLS, 2021)
Healthcare Turnover
There is no other area where employee turnover is and will be more critical than in the healthcare sector. Battered by the COVID-19 pandemic, nurses and other healthcare workers are stretched to their limits.
- Nurse turnover increased to 18.7% in 2020 from 15.9% in the previous year. The 2020 rate is the highest since 2016. (NSI, 2021)
- The turnover rate for all hospital employees also saw a significant spike, from 17.8% in 2019 to 19.5% in 2020. (NSI, 2021)
- Voluntary resignation comprised 93.9% of all hospital turnover. (NSI, 2021)
- Hospital turnover rate was highest in the South East (AL, FL, GA, KY, MS, NC, SC, TN, VA and WV) at 24.6%. This is followed by North Central (IA, IL, IN, KS, MI, MN, MO, MT, ND, NE, OH, SD, WI and WY) at 23.7%. The North East (CT, DC, DE, MA, MD, ME, NH, NJ, NY, PA, RI and VT) has the least turnover rate at 15.7% followed by the West (AK, AZ, CA, HI, ID, NV, OR, UT and WA) at 15.8%. (NSI, 2021)
- The vacancy rate bracket of 7.5% to 9.9% had the highest share at 30.7% in the US in 2020. (NSI, 2021)
- By specialty, step-down nursing had the biggest turnover in 2020, with 24.4%, compared with behavior health (22.7%), emergency (20%), telemetry (19.3%), and critical care (18.7%). The least turnover were in burn centers (9.8%) and surgical services (13.2%). (NSI, 2021)
- In the broader field of advanced practice and allied health, patient care tech had the biggest turnover at 28.6%, followed by certified nursing assit at 27.5%. Turnover for other fields are: medical technologists (13.8%), physician assistant (9.2%), and physical therapist (9.1%). (NSI, 2021)
- The recruitment difficulty index for registered nurses increased for all specialties between 2020 and 2021, except for OR RN, which saw the index drop from 145 to 111, respectively. The specialty with the highest increase is L&D RN, which saw its 2020 index of 65 rose to 86 the next year. (NSI, 2021)
- Nursing staff was predicted to have the biggest shortage in healthcare in 2021, at 83%, at the height of the pandemic. Physicians came in second at 30%. (Merritt Hawkins, 2021)
Source: NSI, 2021
Cost of Recruitment Ad
- The gig economy had the highest cost-per-click (CPC) of recruitment ads placed in the US in 2020 by industry, at $1.13. Other top CPC for ads are healthcare ($0.9), insurance ($0.85), warehousing & logistics ($0.84), construction and skilled traders ($0.73), technology ($0.70), sales, ($0.69), manufacturing ($0.69), transportation ($0.67), customer service ($0.65), and education ($0.65). (Appcast, 2021)
- On the other hand, the least CPC for recruitment ads in the US in 2020 are real estate ($0.38), hospitality ($0.53), marketing and advertising ($0.60), retail ($0.60), and administration ($0.61). (Appcast, 2021)
- Broadly, the CPC of recruitment ads increased from $0.7 in 2018 to $0.79 in 2020, a 12.86% growth. (Appcast, 2021)
Employment Statistics
The US economy didn’t only manage to stay afloat in a time of the pandemic but it has grown, in fact, as reflected by a robust employment rate.
- The no. of full-time employees in the US increased from 124.33 million in November 2020 to 129.32 million a year after. (BLS, 2021)
- From a high of 16.8 million temporary and contract staffing employment in the US in 2018, the figure steadily decreased to 16 million in 2019 and to 13.6 million in 2020. (American Staffing Association, 2021)
- Temporary and contract staffing employment have yet to break the record of 17.2 million in 2000. (American Staffing Association, 2021)
- The average working week (hours) of all employees in the US was the same in November 2020 and November 2021, 34.8 hours. But in this period, the average went through erratic spikes, specifically from 34.9 hours in January 2021 to 34.6 hours the next month before jumping to 34.9 hours in March. (BLS, 2021)
- The monthly job openings in the US slightly dipped to 10.44 million in September 2021 from 10.63 million in August 2021, but it was still significantly above the 6.61 million openings a year before in September 2020. (BLS, 2021)
- Conversely, the monthly no. of the inactive labor force in the US in November 2021 was substantially lower at 99.98 million compared to the 100.55 million exactly a year prior. (BLS, 2021)
- The employment rate of persons with a disability plunged to 17.9% in 2020 from 19.3% the year before. It’s the first time the rate has declined since 2014. (BLS, 2021)

Gig Economy, Part-Time Job Statistics
Tied to mass resignations, the gig economy is growing fast as more employees prefer to work from home, if not at their own pace, unfettered from the office cubicle.
- The number of freelance workers will reach 90.1 million by 2028, from 70.4 million in 2022, a 28% growth rate. (Upwork, Edelman, 2020)
- Recruitment is the biggest challenge to companies dealing with independent contractors in the US in 2021. At a 74% share, it is followed by payment with 68%, management with 65%, onboarding with 64% and legal compliance with 63%. (Stoke Talent, 2021)
- Freelancers were sorted into five categories with their market share in the US in 2020, as follows: diversified workers with 36%, independent contractors with 32%, moonlighters with 21%, freelance business owners with 6%, and temporary workers with 5% share. (Upwork, Edelman, 2020)
- Occasional independent workers had the biggest share in the number of people working independently in the US in 2021, at 23.9 million), followed by full-time independent workers at 17 million and part-time independent workers at 10.2 million. (MBO Partners, 2021)
- Freelance is the second highest paying gig economy job in the US in 2020 by the hour rate, at $25.33. Topping the list is massage therapy with a $27.84 rate. Other top gig economy jobs by hourly rate are home-cooking ($25.23), teaching ($20.81), delivery ($17.1) and handyman ($16.71). (appjobs.com, Indeed, PayScale, 2020)
- Gen Z had the biggest share in freelance participation in the US in 2020 (50%), followed by Millennials (44%), Gen X (30%), and Baby Boomers (20%). (Upwork, Edelman, 2020)
- By education, those with a post-graduate degrees comprised the largest share among freelance workers in the US in 2020. This was followed by high school graduates at 37%, then holders of bachelor’s degree and associate degree at 32% both. (Upwork, Edelman, 2020)
- Upwork generated $60.86 million from freelancers, the highest by country in 2020. India is in second place with $33.11 million, followed by the Philippines with $22.92 million. (Upwork, 2020)
- Unique expertise is the leading reason why US companies work with freelancers in 2021. By department, 36% of marketing agree with this reason, while it’s 48% in R&D and 59% in IT. (Stoke Talent, 2021)
Source: MBO Partners
Remote Work Statistics
Even as the pandemic shows sign of subsiding and employees are being asked to return to work, many have expressed a preference to work from home. Businesses are finding benefits to remote work, so, too, new threats.
- The top benefits for allowing remote work according to employers worldwide in 2020 are increased productivity at 42% share, increased efficiency at 38% share, increased employee morale at 31%, improved employee loyalty and retention at 30%, improved carbon footprint at 30% and improved communication at 28%. (GitLab, 2021)
- In the Asia-Pacific, China has the most no. of employees who prefer to work from the office, with a 64% share. Vietnam is in second place, with a 59% share, followed by Thailand with 58% and Taiwan with 52%. Indonesia, New Zealand and India are tied with 47% of employees preferring office over work-from-home. (PersolKelly, 2021)
- In terms of security protocols, the use of multi-factor authentication for endpoints and servers, additional employee education and cloud or SaaS use visibility control/security are the most used with a 28% share for all while hiring third-party security expertise and SIEM or internal security analytics and intelligence had the least preference with 18% share for both. Other top security protocols include training/upskilling the existing security team (27%), single sign-on (23%), mobile device management (21%), endpoint detection and response (21%) and app delivery and security (19%). (Citrix, Sapio Research, 2021)
- Respondents agreed to change investment levels the most in tools for virtual collaboration with a 72% share. Coming in at second place is IT infrastructure to secure virtual connectivity with 70%, training for managers to manage a more virtual workforce with 64%, and conference rooms with enhanced virtual connectivity with 57%. (PwC, 2021)
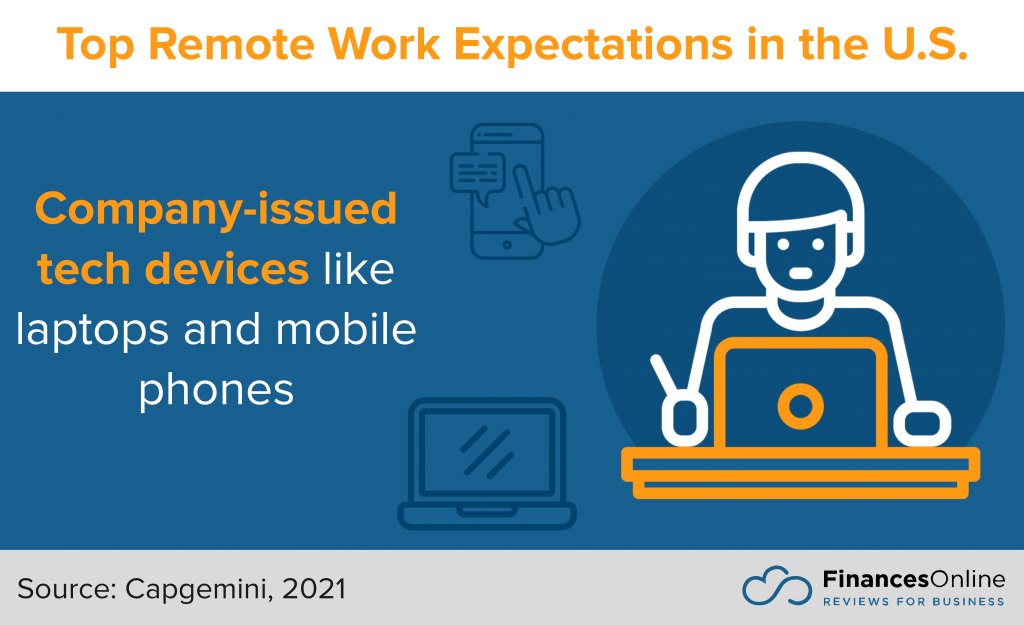
- Employees expect technology devices like laptops and mobile devices to be provided to them the most as for remote workers’ top expectations from their employers (72%). Other top expectations include a sense of job security and stability (71%), financial support to set up a home office (68%), reimbursement for internet and phone charges and energy bills (65%), same monetary or non-monetary benefits as before (60%) and assurance not to discriminate on compensation and benefits based on work location (58%). (Capgemini, 2021)
Training, Career Development Statistics
The fast-changing business landscape needs a talent pool that can adapt to changes quickly. HR managers have the work cut out for them to develop training programs to ensure skills remain relevant.
- The leading HR strategies to fast-track skills development worldwide are identifying new skills/capabilities for post-COVID-19 operations (53%), developing remote working skills with an emphasis on virtual collaboration (48%), exploring ways to effectively move and develop talent based on skills (45%), gathering information on individuals’ current skills (34%), and adding virtual experiences to mentoring or sponsorship programs (31%). (Mercer, 2021)
- In the healthcare sector, career potential is the least of reasons why employees stay on the job in 2020, with a 19% share. The top reasons are organization culture with 44% share, colleagues with 43% and compensation package with 37% share. (Merritt Hawkins, 2021)
- The majority of US companies relied on internal learning and development to reskill or upskill their employees in 2020, with a share of 42.8%. External online training followed with 21.9% share, then private training providers with 14.3% share and public educational institutions with 8.1% share. The last two on the list were private educational institutions with 7% share and public training providers with 5.9% share. (World Economic Forum. (2021)
Benefits & Compensation Statistics
Wellness and life-work balance take an increasing share in employee benefits preference. HR managers must see to their inclusion when developing compensation packages.
- 61% of Gen Z and 57% of Millennials worldwide said they would feel less stressed about finances if their employers provide them with financial wellness benefits. (SoFi, Forbes, 2020)
- Share of benefit type offered by employers in the US in 2020: major medical health insurance (86%), 401(k) or other retirement programs (78%), dental insurance (73%), vision insurance (67%), life insurance (64%), disability insurance (51%), and supplemental insurance (31%). (Aflac, Kantar, 2021)
- Most important employee benefits according to respondents: in the US in 2020: health insurance with 57%, life insurance with 33%, employee assistance program with 29%, disability insurance 27%, workplace wellness program with 24%, long-term care insurance with 19%, financial wellness program with 18%, critical illness insurance with 17%, and cancer insurance with 9%. (Transamerica Center for Retirement Studies, 2021)
- Share of employer costs for employee benefits in the US in 2021 among civilian workers: insurance (8.4%), paid leave (7.4%), legally required benefits (7.2%), retirement and savings (5.1%), and supplemental pay (3%). (BLS, 2021)
- Most common employee benefits in North America in 2020: health insurance with 68%, paid time off with 63%, dental insurance with 59%, retirement savings plan with 55%, life insurance and AD&D insurance with 54%, vision insurance with 52%, disability insurance with 46%, employee assistance programs with 42%, leave of absence/sabbatical with 34%, tuition assistance or reimbursement with 33%, and pretax programs with 26%. (Robert Half, 2020)
- In the last ten years, the average annual health premiums per employee have increased by 42.55%, from $5,429 in 2011 to $7.739 in 2021. (KFF, 2021)
Security and Privacy in HR Software
In today’s digital landscape, ensuring the security and privacy of sensitive employee data is critical. As HR software evolves, it handles a growing amount of personal information such as salaries, health details, and performance data. This makes the implementation of robust security measures non-negotiable.
- Data Encryption: One of the primary security measures is encryption. HR software providers use encryption protocols to protect employee data both during transfer (e.g., over the Internet) and while it is stored, helping prevent unauthorized access.
- Compliance with Data Protection Regulations: HR software must comply with privacy regulations such as GDPR in Europe or CCPA in California. These laws require HR platforms to safeguard personal information and allow employees to exercise their privacy rights, like requesting data deletion.
- User Authentication and Access Control: Role-based access control (RBAC) ensures that only authorized personnel can access sensitive information. Multi-factor authentication (MFA) further strengthens this layer of security, preventing unauthorized users from accessing employee data.
- Regular Audits and Monitoring: To maintain security standards, HR software providers perform regular security audits and monitoring to detect potential vulnerabilities or suspicious activities.
HR as Key Business Driver
Far from being a back-office unit, HR is taking a more strategic role to help companies face up to industry changes. The pandemic only hastens the shift to digitization, a slew of unrelenting challenges on its trail from upskilling employees with the latest tech skills to battling it out for top talents. Here, HR managers must foster business ROI in vested talent sourcing and management to keep the business, not just running, but stay competitive. They have new technologies to turn to, reaping the benefits of HR software. Being knowledgeable of the latest HR trends and the HR software statistics above, HR managers should face the future with greater certainty.
Key Insights
- Dominance of HR Tech: HR technology companies are recovering faster than HR consulting firms post-pandemic, with stock prices of Service Now, Ceridian, and Workday significantly outperforming traditional HR consulting firms.
- Female Dominance in HR: The HR profession remains predominantly female, with women holding 76.8% of HR manager positions.
- Increasing Demand for HR Professionals: The number of HR professionals has been steadily increasing, with projections indicating continued growth, reaching an estimated 840,120 by 2025.
- High Salaries in Certain Sectors: HR managers earn the highest salaries in sectors like Securities, Commodity Contracts, and other Financial Investments, with annual mean wages reaching up to $184,440.
- Impact of Job Automation: By 2030, 47% of jobs in the US are at risk of automation, with transport and logistics facing the highest risk at 70.5%.
- Growth in HR Software Market: The HR tech market is expected to grow significantly, reaching $90 billion by 2025, driven by increased demand for digital solutions in HR management.
- Remote Work Trends: Remote work is driving investments in virtual collaboration tools, IT infrastructure for secure connectivity, and training for managers to handle virtual teams effectively.
- Recruitment and Turnover Challenges: The Great Resignation has intensified recruitment challenges, with high turnover rates in sectors like healthcare, particularly among nurses.
- Freelancing on the Rise: The number of freelance workers in the US is projected to grow from 70.4 million in 2022 to 90.1 million by 2028, indicating a shift towards more flexible work arrangements.
- Employee Benefits and Compensation: Health insurance remains the most important benefit for employees, with wellness and financial security becoming increasingly significant in compensation packages.
FAQ
- What are the current trends in HR technology?
HR technology is rapidly growing, with a market size expected to reach $90 billion by 2025. Key trends include increased use of AI, machine learning, and big data analytics to enhance HR functions like recruitment, employee engagement, and performance management. - How has the COVID-19 pandemic affected the HR industry?
The pandemic has accelerated the adoption of HR technologies and remote work trends. HR tech companies have recovered faster than traditional consulting firms, and there’s been a significant increase in the demand for virtual collaboration tools and secure IT infrastructure. - What is the gender distribution in the HR profession?
The HR profession is predominantly female, with women holding 76.8% of HR manager positions. - What is the future outlook for HR professionals?
The number of HR professionals is expected to continue growing, with projections estimating 840,120 HR employees by 2025. This growth is driven by the increasing importance of HR in managing remote work, recruitment challenges, and employee development. - Which sectors offer the highest salaries for HR managers?
Sectors like Securities, Commodity Contracts, and other Financial Investments offer the highest salaries for HR managers, with annual mean wages reaching up to $184,440. - How is job automation impacting the HR industry?
Job automation is expected to significantly impact the HR industry, with 47% of jobs in the US at risk by 2030. HR professionals need to focus on reskilling and upskilling employees to mitigate the effects of automation. - What are the key challenges in recruitment and staffing?
The Great Resignation has intensified recruitment challenges, particularly in sectors like healthcare with high turnover rates. HR managers must adopt creative hiring strategies and improve employee retention to address these challenges. - How is the gig economy influencing the HR landscape?
The gig economy is growing rapidly, with the number of freelance workers projected to reach 90.1 million by 2028. HR managers need to adapt to this trend by developing strategies for managing and supporting freelance and contract workers. - What are the most important employee benefits?
Health insurance remains the most important benefit for employees. Financial wellness programs, wellness initiatives, and flexible work arrangements are also becoming increasingly significant in employee compensation packages. - What investments are companies making to support remote work?
Companies are investing in tools for virtual collaboration, IT infrastructure for secure connectivity, training for managers to handle virtual teams, and providing financial support for home office setups.
References:
- American Staffing Association. (2021). 2021 Staffing Industry Playbook. AmericanStaffing.Net. Retrieved January 10, 2022, from American Staffing Association.
- AMN Healthcare. (2021). 2021 Healthcare Trends Survey Report. MerrittHawkins.Com. Retrieved January 10, 2022, from Merrit Hawkins.
- Appcast. (2021). 2021 Recruitment Marketing Benchmark Report. Dropbox.Com. Retrieved January 10, 2022, from Appcast.
- Bureau of Labor Statistics. (2021, February 4). Persons with a Disability: Labor Force Characteristics—2020. BLS.Gov. Retrieved January 10, 2022, from BLS.
- Bureau of Labor Statistics. (2022a, January 4). Job Openings and Labor Turnover – November 2021. BLS.Gov. Retrieved January 10, 2022, from BLS.
- Bureau of Labor Statistics. (2022b, January 7). The Employment Situation — December 2021. BLS.Gov. Retrieved January 10, 2022, from BLS.
- Bureau of Labor Statistics. (2022c, January 9). Job Openings and Labor Turnover Survey. BLS.Gov. Retrieved January 10, 2022, from BLS.
- Columbus, L. (2020, December 27). Top 10 Tech Job Skills Predicted To Grow The Fastest In 2021. Forbes.Com. Retrieved January 10, 2022, from Forbes.
- Fersht, P. (2018, February 3). Automation to impact 750,000 low skilled Indian jobs, but create 300,000 mid-high skilled jobs by 2022. HorsesforSources.Com. Retrieved January 10, 2022, from HorsesforSources.
- GitLab. (2021, March). 2021 Remote Work Report. GitLab.Com. Retrieved January 10, 2022, from GitLab.
- Global Recruitment Insights & Data. (2021). NA Recruitment Trend Report. Grid.Bullhorn.Com. Retrieved January 10, 2022, from GRID.
- Goddies, S. (2021, May 25). 10 Largest Recruiting Firms in the United States. Zippia.Com. Retrieved January 10, 2022, from Zippia.
- IDC. (2021, July 19). IDC: China’s human capital management SaaS market continues to grow rapidly. IDC.Com. Retrieved January 10, 2022, from IDC.
- Kelly, R. (2020, November 18). Top Applicant Tracking Systems (ATS Software) in 2020. OnGig.Com. Retrieved January 10, 2022, from OnGig.
- Kupper, D., Lorenz, M., & Et Al. (2019, March 27). Advanced Robotics in the Factory of the Future. BCG.Com. Retrieved January 10, 2022, from BCG.
- Liu, S. (2018, May 8). Mobile workforce management software and services market value worldwide form 2017 to 2023. Statista.Com. Retrieved January 10, 2022, from Statista.
- Milltown Partners. (2021, November). Our Relationship with AI: Friend or Foe: A Global Study. CliffordChance.Om. Retrieved January 10, 2022, from CliffordChance.
- Mlitz, K. (2021, September 20). Share of jobs at high risk of automation by 2030, by region and industry sector. Statista.Com. Retrieved January 10, 2022, from Statista.
- NSI Nursing Solutions, Inc. (2021, March). 2021 NSI National Health Care Retention & RN Staffing Report. NSINursingSolutions.Com. Retrieved January 10, 2022, from NSI.
- Pang, A., Markovski, M., & Zdravkovski, M. (2021, December 24). Top 10 HCM Software Vendors, Market Size and Market Forecast 2020–2025. AppsRuntheWorld. Retrieved January 10, 2022, from Apps Run the World.
- PersolKelly. (2021, September). Workforce of the Future. PersollKelly.Com. Retrieved January 10, 2022, from PersolKelly.
- PricewaterhouseCooper. (2018). Will robots really steal our jobs? An international analysis of the potential long term impact of automation. PwC.Co.Uk. Retrieved January 10, 2022, from PwC.
- Randstad. (2020). Randstad Annual Report. Randstad.Com. Retrieved January 10, 2022, from Randstad.
- Sapio Research. (2021, September). The State of Security in a Hybrid World. Citrix.Com. Retrieved January 10, 2022, from Citrix.
- Statista. (2017, March). Share of jobs at high risk of automation by early 2030 in select countries worldwide, by study, as of 2017. Statista.Com. Retrieved January 10, 2022, from Statisa.
- Statista. (2021a). Gig economy in the U.S. Statista.Com. Retrieved January 10, 2022, from Statista.
- Statista. (2021b). HR Tech. Statisa.Com. Retrieved January 10, 2022, from Statista.
- StokeTalent. (2021, March). How Are Companies Leveraging the Freelance Economy. StokeTal;Ent.Com. Retrieved January 10, 2022, from StokeTalent.
- U.S. Bureau of Labor Statistics. (2020a). Labor Force Statistics from the Current Population Survey. BLS.Gov. Retrieved January 10, 2022, from BLS.
- U.S. Bureau of Labor Statistics. (2020b, May). Occupational Employment and Wage Statistics. BLS.Gov. Retrieved January 10, 2022, from BLS.
- U.S. Securities and Exchange Comission. (2021, March 2). FORM 10-K. Workday.Com. Retrieved January 10, 2022, from Workday.


Leave a comment!